logbook: Glozzy graphs
Worked in a few different areas this week:
- polished off the job of outputting Glozz XML
- intake pipeline
- studied a couple of annotation models
- started playing around with build a graph representation of annotations (scroll down for a picture)
Glozz XML
It turns out the trouble I was having (making Glozz crash) was basically due to the fact that I wasn’t associating my annotations with any metadata (author, creation date, etc).
Working on this problem has also given me a chance to think a little bit about how to deal with the problem of generating identifiers for automatically derived annotions in Glozz, which in turn forced me to get to know the Glozz annotation model a bit better. The basic story is that timestamps are not great basis for creating identifiers, nor is a simple counter-based strategy not sufficient to guarantee uniqueness within the corpus (see glozz model notes for thoughts why). With these thoughts about global uniqueness in mind, I’ve decided on the following identifier scheme for our particular corpus:
- tool-name
- document
- subdocument
- a counter
The counter is just some integer based on the number of existing annotations in the document. I take the biggest existing number and bump up a couple powers of ten for readability, then start counting.
Also, it appears that Glozz relies on the creation date of annotations (annotations that have the same creation date as some existing annotation simply don’t show up in the GUI). Other tools in the pipeline use the convention of negative numbers as timestamps (where timestamping is not relevant I suppose). I just use the same counter that I use to generate dates.
Intake pipeline
At the moment, preparing incoming chat files for annotations requires an interleaved mixture of scripts and manual work. I decided it would be a good idea to set some duct tape to the task by stringing together as many of the automatic bits into a Bash scripts that we can run. This should allow for some extra repeatability and make it easier to fold it enhancements to our intake pipeline, for example if we find ways to automate some of the manual prep work.
This was a surprisingly useful thing for me to do, not so much for the pipeline in itself (although I think it’ll serve us) but for learning my way around our existing tools, around the Glozz model, and the annotation task in general.
Annotation models
So far have looked at Glozz and also at the annotation graph stuff in A Formal Framework for Linguistic Annotation by Bird and Liberman (2000). Hope to have my notes for the latter out by next week some time.
Graphs
One of the bigger pieces of work I’ll be doing for educe is to provide a navigable higher-level representation of the annotated corpus. What educe currently gives is as low-level as we can get, a document being some text and sets of annotations that sit on top of these. There are a couple of more useful structures we can derive from this. One of these would be a representation of the discourse graph (probably not the right terminology).
The good news for me is that Somebody Else has developed a nice-looking library called python-graph. It seems to do hypergraphs, which will be useful for us when dealing with complex discourse units. One handy utility any graph library should come with (and which this one does) is an option to output to graphviz.
Here’s a sample graph showing a small chunk of our annotated conversation (with dot file too):
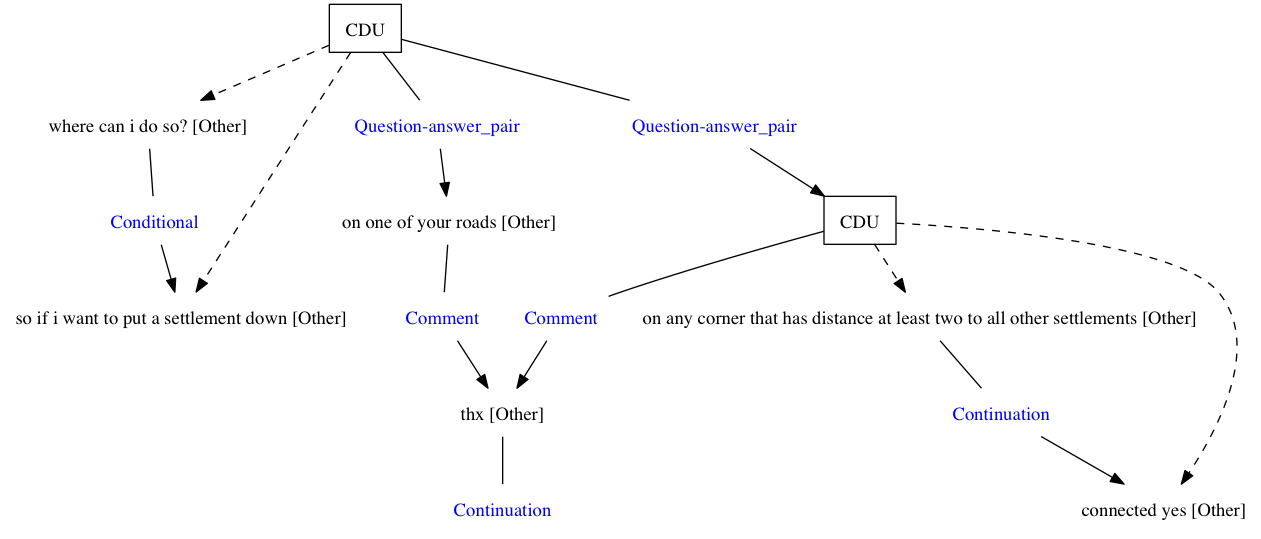
(click to enlarge)
It’s worth noting that this is plain old non-hyper-graph. A better representation would be for the CDU to be treated as a subgraph rather than a node pointing to other discourse units. Also minor note, in the current abstract graph, I’ve got relations being represented as nodes rather than edges (ie. you you edges going into and out of the relation). This is just to deal with annotation files that have relations pointing to relations (something Glozz allows). It’s there for visualisation, but for a more abstract representation, we’re going to want something a bit nicer.
Next week will most likely involve me exploring the hypergraph portion of the python-graph API (via the concrete task of getting gv subgraphs) and some more study of annotation models.