Concept diagrams prototype
For the past 6 months, I’ve had the pleasure of working with the University of Brighton Visual Modelling Group. With the few remaining days of my time, I thought I would write a bit about my work: an ontology editor prototype based on a visual logic language.
Note This will be a fairly lengthy and detailed post covering three Eric-months of work (I was half-time). What I had initially intended as a quick little blog post quickly ballooned into an informal writeup for any future inheritors of this project. You may instead be interested in viewing the screencast, which provides an overview of what the editor does.
Background
The VMG are a friendly group of maths and computer science researchers who are working on visual languages and fleshing out the maths and logic behind them. The work they do combines maths and theoretical computer science (formal properties of the languages) with some human computer interaction research (making visualisations as clear and communicative as possible). One avenue they are exploring in their work is the use of visual languages to represent ontologies. With some theoretical work under the belts, the VMG were looking to further advance their research by producing a working tool that people could use and provide feedback on.
Ontologies and concept diagrams
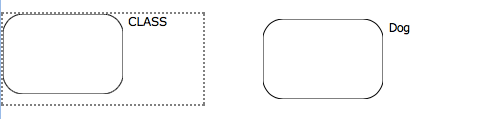
An ontology is a formal way of describing a part of the world, often as a set of classes (eg. Dog) and their relationships with each other (eg. Puppy ⊑ Dog). There are load of interesting applications for ontologies, as tools for thinking, communicating, or reasoning about about the world. You can imagine ontologies playing a role for example, in an interactive biology textbook, or medical diagnostic assistants, or an aircraft maintenance guide; all building off complex knowledge about how things interrelate. The downside to all this useful formally structured knowledge is that it can also be extremely complex and detailed; when we make explicit the many facts we would otherwise take for granted, the end result can often be an unwieldy mess. And even if we say that a given ontology is intended to be consumed by computers only, it still has to be built and maintained by humans.
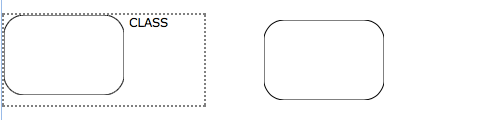
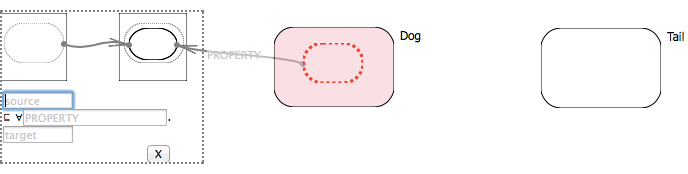
So how do you take a big blob of formal structure fit for human consumption? One possibility the VMG propose is to make use of concept diagram, a formal graphical notation with classes represented as shapes (circles or rounded rectangles), properties as arrows, individuals as dots, and along with other notational details (labels, shading, a representation of the universe). For example, you might represent the class Dog as a rounded rectangle:

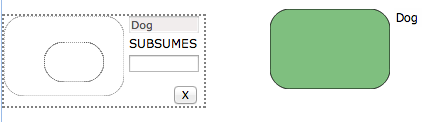
To represent the axiom Puppy ⊑ Dog (the class Puppy is subsumed by Dog), you would nest a smaller rectangle within it:

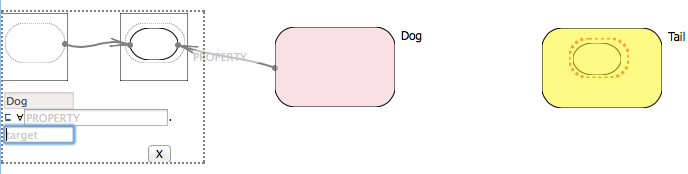
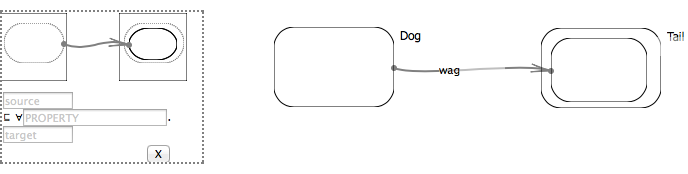
Likewise you might say Dog ⊑ ∀ wag. Tail (dogs wag only tails — such is the trickily precise world of ontologies) with a combination of nested shapes and an arrow:

It may be worth mentioning that what makes these diagrams interesting isn’t so much that they are pictures, or even particularly intuitive at first glance. In fact, being defined by a set of precise rules, concept diagrams actually require a bit of training on how to correctly interpret them (for example, a dashed arrow S ⤏ T asserts that some binary relationship exists between individuals in the set S and all individuals in the set T; and a solid arrow S → T strengthens this to say that it exists between all and only the individuals in T). Having such rules behind the diagrams means that we can more easily link them to the equally formal systems that define ontologies. But as a broader point, mass accessibility need not necessarily be what makes visualisations useful. Perhaps over time, the concept diagram will prove to provide enough clarity and communicative power to make it worth the learning curve for people working with ontologies.
WebProtégé
Having fleshed out and pinned down the behaviour of the concept diagram formalism, the VMG wanted to turn their LaTeX and whiteboard thinking into actual working code that people could try and use to build ontologies, which is where they brought me on board 1.
One of the technical goals of the project is for the plugin to work with the WebProtégé ontology editor (You may be more aware of the desktop editor Protégé, which while more mature, is slated to be phased out in favour of its web cousin.) WebProtégé is a powerful and extensible ontology editor that offers a wide range of ontology-editing components that can be added to and removed from the editor according to need.
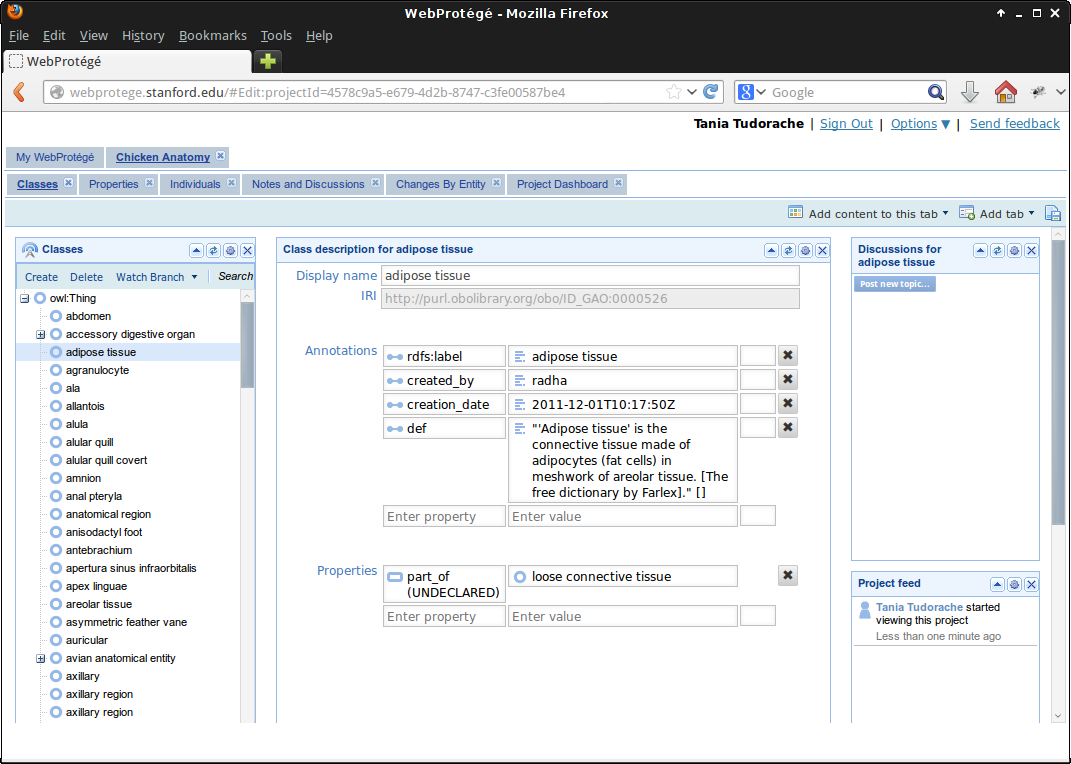
The basic class and property components present a collapsible tree structure (to convey the subsumption hierarchy), which users can modify by dragging classes from one part of the tree to another. Selecting a class opens it in an class editor widget which allows you to modify its properties (relationships with other classes) and annotations. There are also more powerful components like the new OWL Entity Description Editor which make it possible to express more complex axioms such as the Dog ⊑ ∀ wag. Tail. From a user interface standpoint, this division of WebProtégé into essentially standalone components makes it natural for us to develop the concept diagram prototype as yet another component that users could select.
Design
Pattern library
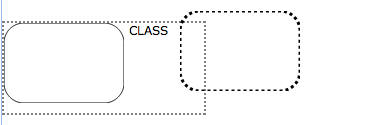
Concept diagrams can require a bit of training to use correctly, and it sometimes takes a bit of caution to express what seem like a straightforward idea at first glance. For example, it may be tempting to express the idea that members of the Dog and Tail are wag-related with a simple arrow:

But which dogs and which tails? Do dogs wag other non-tail things? Are tails wagged by other non-dog things? What exactly are we saying? A more precise assertion would using the All Values From object property expression, as in Dog ⊑ ∀ wag. Tail. The pattern for expressing All Values From is somewhat more complicated. In addition to the two curves and an arrow, we have the arrow pointing to a smaller shape within the Tail (because dogs don’t wag all the tails in the universe, eg. those that belong to cats), but they wag all of an unknown subset of them:
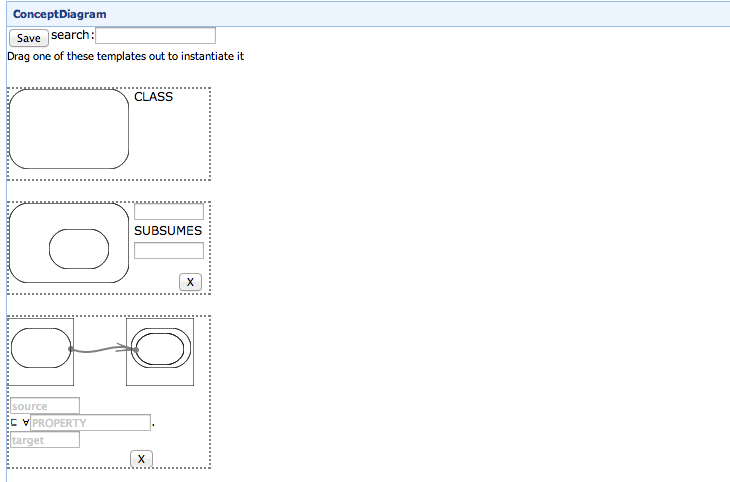
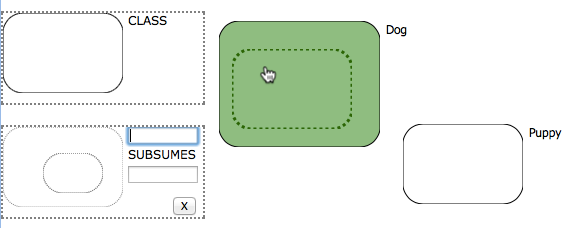
To steer users around these sort of notational pitfalls, the VMG felt that it would be best to encapsulate common ontology idioms in a set of ready-made patterns that one would only have to instantiate. For example, there might be an All Values From pattern with a Class1, a Class2, and a property label to apply: 2

As we are working within the context of a prototype with only three patterns implemented, we could straightforwardly express the notion of pattern library by simply reserving a side of the canvas for patterns, leaving the rest for diagrams proper:
This interim measure will need to be revisited in the future as the pattern library grows. For example, the pattern library may need to have a scrollbar, or as the number of patterns grow, some sort of thumbnail and magnification-based idiom, or perhaps pages or sections. How exactly to express this depends partly on the number of patterns we would end up with and also how pattern instantiation works. Note that that one minor technical challenge to overcome in a more sophisticated pattern library would involve dragging and dropping shapes from the library onto the main canvas. We currently skirt around the issue by simply having the library be part of the canvas, but once they are in separate logical spaces, managing the seamless transition of an object from one space into another may become a challenge.
Idioms (dropping vs. snapping)
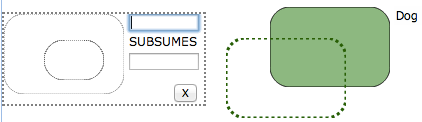
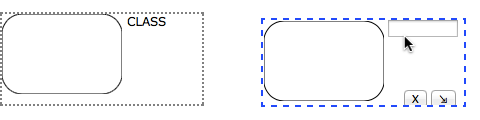
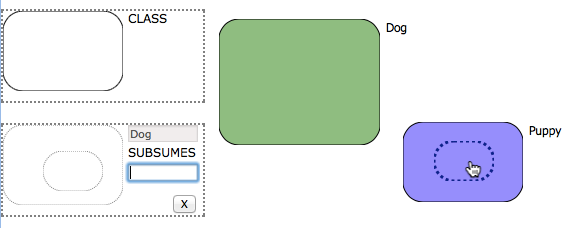
To say that the user interface should be based on patterns is not enough. What exactly should a pattern do? How do we interact with it? Our current approach provides for two pattern idioms: drag and drop vs. drag and snap. Drag and drop is currently only used for class instantiation, the most of basic of patterns. Here, the user selects a curve in the pattern and simply drags it out onto the canvas. This creates a new anonymous curve on the screen which can then be assigned a name, resized, and moved around:
Dragging and dropping works well for class instantiation because it does not require any interaction with objects already on the canvas. But for more complex patterns, we often want to express relationships between objects, and some of those objects may already be part of the diagram in progress. A simplistic drag and drop interface for such patterns may be cumbersome to use because of the redundancy it creates with pre-existing curves. One of the curves would have to be deleted. Alternatively, one could envisage a piecemeal drag-and-drop approach, where the user selects only parts of the pattern to drop in, leaving the already instantiated elements behind. But the pattern in such a scenario serve only as a reminder and provide no guarantees that the diagram is being built correctly.
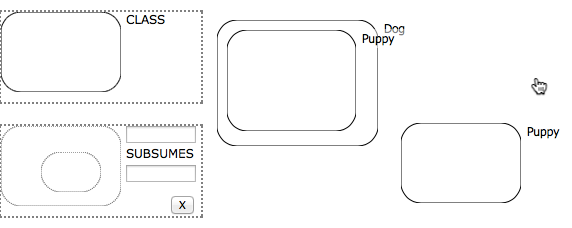
Our current approach for more complex patterns is to use a “drag and snap” idiom. Here the pattern is composed of multiple user-selectable “endpoints” where each endpoint is dragged on to a pre-existing curve in the canvas and “snaps” into place (a bit like unification, to give an analogy). Once all endpoints of the diagrams are snapped into place, the pattern is considered complete the actions will trigger:
The drag-and-snap idiom generalises at least well enough for two somewhat different patterns (Subsumption and All Values From). However, there remain some potentially troubling open issues at least in the current incarnation of this idiom. Broadly speaking, it’s not immediately obvious how to interact with patterns using such an idiom. Looking over their shoulder, I’ve noticed users trying to pull drag-and-snap shapes out onto the canvas and trying to treat the endpoint curve as though it were a normal curve that you might see elsewhere on the canvas (in effect, treating drag-and-snap as though it were drag-and-drop). Likewise, if the pattern provides search boxes (to narrow down the snap candidates for a given endpoint), users can be strongly tempted to use them to name the curves. This can be avoided perhaps by labelling the search boxes with a magnifying glass icon, or by centralising them to a single global search box that always selects for the currently selected endpoint. As for the broader confusion, making the drag-and-snap endpoint more visually distinct (dashed borders) seems to help somewhat. Another solution may be to automatically reset endpoints that are brought out to the canvas but left unsnapped, thus avoiding the possibility for lingering endpoints to be misread as part of the diagram.
Usage
The plugin is organised with a pattern library sitting besides a canvas. The current library is fairly small, providing for three basic patterns:
- class instantiation (drag-and-drop)
- subsumption (drag-and-snap)
- all values from (drag-and-snap)
There is actually a much wider range of ontology-editing patterns proposed in the concept diagrams canon, but my hope is that many of these will be variations on the three above and relatively easy to implement.
Adding things to the canvas involves dragging something from one of the patterns onto the canvas. For class instantiation, this consists in dragging and dropping a curve out onto the canvas. Once instantiated, a curve can be moved around, assigned a label, resized, and deleted. Each curve stays on the canvas, fairly nondescript, until it is moused over. At that point, it is highlighted and various widgets come into focus (the label transforms into an editable text box, and a delete and resize button appear nearby the class). For the other patterns, we instead drag curves from the pattern and “snap” them onto one of the curves already on the canvas.
Patterns
Class instantiation
Class instantiation works by pulling a curve out from the Class pattern onto the canvas (click images to play below). Assigning a label to the curve triggers an ontology update (an equivalent class is added to the ontology). Likewise, changing or removing the label also updates the ontology. In the other direction, some updates to the ontology are reflected in the diagram (removing or renaming a class); however, some updates (adding a class) are not. Much of the prototype is in this state, where there is a working front end that triggers updates to the underlying ontology; but not all updates from the other direction are supported.
Note that in the current implementation of the prototype, multiple curves are explicitly allowed to share a label (and correspond to the same class) if they do so. This makes renaming and deleting curves potentially subtle. When renaming or deleting a curve, we have to check if the curve being renamed is the only one of its kind (we must refrain from updating the ontology if not), or if the new name for the curve already exists in the ontology.
Subsumption
Subsumption is expresses the idea of generality, that members of the subsumed class are also members of the subsuming one (eg. we write Dog subsumes Puppy as Puppy ⊑ Dog). The pattern uses the more complex drag-and-snap interaction with two endpoints, the outer subsuming curve, and the inner subsumed one, both of which are to be snapped onto an existing curve on the canvas. The subsumption pattern allows the user to snap endpoints in any order, resulting in the same updates to the underlying ontology. The visual effect is partly dictated by the last endpoint to be snapped. If the last endpoint represents the subsuming curve, we make a copy of the first curve and place it inside the second one. Conversely, if the last endpoint represents the subsumed curve, we copy the first curve and place it around the second one.
In its current state, the subsumption pattern comes with a hefty list of caveats. Just as with class instantiation, we only have a one directional link between the plugin and the ontology. Using the subsumption pattern triggers an ontology update; but updating the ontology does not trigger any reaction from the plugin. For that matter, the plugin does not detect free form subsumption events whereby the user drags and resizes one curve inside another without invoking the subsumption pattern. Also the fact that we copy curves (and more generally, allow multiple curves per class) greatly hurts the readability of the diagrams. I’ll say a few more words about these shortcomings at the end of this post, both the lack of free-form subsumption detection and the very unfortunate duplication of curves.
All Values From
The All Values From restriction in OWL (a standard ontology language) describes an anonymous class consisting of all individuals whose value for a given property belongs to a specific class (for example ∀ wag. Tail refers to all individuals who wag tails if anything at all 3). As we saw in an earlier example this restriction plays a role in one of the concept diagram patterns where we use an arrow to express the idea that a given class fits under this restriction (eg. Dog ⊑ ∀ wag. Tail):
The bulk of this pattern borrows from the drag-and-snap idiom in subsumption. The user controls two endpoints corresponding to the source and target side of an arrow (eg. Dog and Tail). When both endpoints are snapped, the plugin creates an anonymous curve inside the target one and points the source curve to it. The resulting arrow has a text entry that can be filled with a property name, which (similarly to how classes are added to the ontology when named) once entered triggers an update to the ontology backend, creating the property and class restriction as needed and expressing the appropriate subsumption relation (we can see the results in the OWL Entity Description Editor provided by WebProtégé).
As with subsumption, the All Values from Pattern mostly serves as a proof of concept with holes and missing functionality in critical places. The relationship with the ontology is once again unidirectional (applying the pattern updates the ontology, but the plugin does not notice changes made to the ontology from the outside). Likewise, perfectly reasonable actions such as moving the newly created anonymous curve around are not noticed by the plugin. Also we currently do not provide any mechanism to modify the property arrows (neither detach nor delete), the somewhat slim silver lining for this being that at least avoids there being another issue about keeping the ontology up to date.
Saving and loading
The plugin supports a limited notion of persistence. Changes to the ontology itself are already saved and loaded for free by WebProtégé. When opening a given ontology, the plugin checks to see if it has stored a representation of the diagram on the server and populates the canvas accordingly. Unfortunately, diagrams are not yet saved automatically — the user has to press a button to trigger a save — but it would be quite important to implement such a feature (at the moment, saving sends over the information needed to reconstruct the diagram in one batch; a better approach would likely send incremental updates on each manipulation). Also, persistence has not yet caught up with the more recent work on properties (eg. in the all values from pattern), so it only saves and loads curves/classes, and not labels.
Overall, the mismatch between the complete and invisible ontology saving supplied by WebProtégé, and the partial manual-only saving provided by the plugin means that the state of the canvas will tend to be out of synch with the ontology. The save functionality mostly works only as a convenience for testing the plugin and will need to be extended to be genuinely useful.
Development
My development process was very much exploratory and incremental, with a focus on hitting a series of concrete milestones (selecting further milestones along the way), and discovering what the core issues were along the way. This development style lent itself to the somewhat fast and fluid situation where (1) we had only a vague idea what the prototype should do and so needed a concrete starting point from which to hold a more productive discussion on the design (2) were working with limited time and unfamiliar technology and therefore wanted to minimise the amount of upfront cost to the project. Most of the development was driven first by implementing the user interface for a new feature, mostly to further develop ideas about how the interaction should work and later on to flesh out its backend before moving to a new milestone.
Languages and libraries
WebProtégé itself is implemented in Java and GWT (a Java web programming framework that compiles client side code to JavaScript), and so much of the plugin is written in the same language.
When I first joined the project, I was eager to avoid Java — being a Haskell programmer at heart I would prefer more concise programming coupled with a powerful type system — and jump to an alternative JVM language like Scala; however, the sticking point is that much of the plugin code is client-side, and efforts to build Scala GWT support appear to have stalled. Generally speaking, the compilation from Java to JavaScript ties our hands somewhat and can limit the Java libraries that we can adopt (all its dependencies must have GWT support). That said, at least the Guava libraries provide some useful additional (sort of an augmented standard library) features, as does Project Lombok (useful Java annotations for automated constructor, getter/setter generation, and a @NonNull runtime check). These make for a fairly verbose and not particularly safe better than nothing. Perhaps the most likely path forward in the future would be to see the WebProtégé project move to Java 8, and try to make do with the language improvements there.
Canvas management
The client side of WebProtégé and the plugin consist of JavaScript executed in the browser (producing a combination of HTML and SVG code along the way). The canvas end of this is cobbled together from a mixture of libraries and methods:
- Widgets and handlers (GWT): widgets such as button and text boxes, as well as event handlers are provided by GWT (the code for these is written in Java and automatically compiled down)
- Shapes and curves (Raphaël): the rounded rectangles used to represent classes are drawn with the Raphaël JavaScript library, largely through the intermediary of raphaelgwt (not to be confused with a similar, likely equivalent project, raphael4gwt)
- Arrows and dragging (JsPlumb): shapes are connected with the help of the JsPlumb JavaScript toolkit, with a thin layer of helper code written in JavaScript and exposed to the Java client code via GWT’s JSNI mechanism.
- Highlighting and ephemera (Java and CSS): some visual effects such as a blue boundary around the currently moused-over curve are baked into the plugin stylesheet
This unwieldy combination of technologies is held together with a somewhat displeasing amount of string and duct tape. It may be attractive to find a more full-featured framework (perhaps d3) that can cover more ground with a single uniform model.
As an illustration of how these libraries are stitched together, consider the case of user-editable labels on arrows. We make use of JsPlumb’s ability to place custom “overlays” in the label position consisting of arbitrary DOM objects. We would typically express these as JavaScript functions that create and return the objects in question (a textbox); however, we also require the plugin (the Java code) to be able to keep track of what the user typed into label. It took some trial and error, but in the end, I ended up generating a textbox widget and DOM identifier in GWT and passing the identifier on to JsPlumb via an anonymous function that always executes a JQuery selector for the textbox id.
Likewise, the Raphaël library provides us with the ability to draw and perhaps animate shapes, but does not appear to provide a way to connect these shapes, or react to their being moved around (connections to shapes should move with the shapes). That functionality can be addressed with JsPlumb; however, it can only manipulate HTML DOM objects (notably div elements) and not the individual SVG objects that Raphaël uses. The end result is that we have a canvas composed of many JsPlumb-managed div elements, inside of which is a miniature SVG document containing a single curve.
Integration
At the time of this writing, WebProtégé does not offer a mechanism for developing third party plugins (unlike its desktop cousin), but we believe that this will come in due course.
In the meantime, I have tried to keep the plugin as self-contained as possible. The code lives in a completely separate package from WebProtégé proper, as do its JavaScript, CSS modules, and GWT module files. As it stands, the places where I have modified the WebProtégé code itself include:
- server side: registering actions implemented by the plugin with WebProtégé’s dispatch mechanism (will be obviated by future WebProtégé annotations)
- client side: registering the concept diagram portlet with the UI factory (likewise to be obviated)
- UI configuration: adding a user-defined tab to the UI configuration XML file (WebProtégé UI configuration mechanism to be rethought in the future)
- build system: referencing the plugin GWT module file from the WebProtégé one (potentially difficult to avoid)
- third party libraries: extending the WebProtégé Maven repository with dependencies used by the plugin (potentially hard to avoid; the alternative would be changing the build file)
Future work
In its current state, the plugin should be treated as more of a proof of concept than a useful ontology building tool. It shows us what ontology editing might look like using a formal visual language such as concept diagrams and hopefully motivates future work into building something closer to a production quality editor. Getting from prototype to usable tool will require a progress in different areas:
- filling out partial functionality
- improvements to the user interface
- critical features
- backend improvements
Bugs and partially implemented features
Some of the partially working components in the plugin should be possible to flesh out with “just” a matter of work:
- Saving and loading only supports curves and not properties
- There is no way to interact with properties aside from changing their labels
- Anonymous classes cannot be snapped to
The full list of bugs and half-features is fairly extensive and can be found on the issue tracker in my GitHub branch.
User interface shortcomings
Canvas manipulation is fairly awkward as currently implemented. From a development perspective, it would be a good idea to try and address the awkwardness before internalising it and forgetting to be bothered by it. For one thing, the plugin is quite sensitive to mouse positioning, and mousing out when in the middle of editing a label can be somewhat frustrating.
Likewise, resizing is implemented in a fairly non-standard way (largely for ease of implementation): the user (1) hovers over the class (2) presses the resize button to initiate resize mode (3) drags the mouse to resize (4) releases the mouse button. Aside from being non-standard for users accustomed to more common idioms (a mode-switch which happens immediately as the user mouses over a corner), the resizing action is also extremely sensitive to the placement of the mouse. It is to stop the resizing action accidentally by drifting the mouse over a different object in the canvas that happens to be in the vicinity.
A more serious issue is that the prototype does not account for object selection in the case of overlapping (any behaviour here is an accident of the DOM as much as anything else). This issue must absolutely be addressed if the plugin is to get any use in the real world. In low-level terms, the solution may have to involve promoting smaller objects along the Z-index so they are more accessible than the larger objects behind them. Overall I believe that my fuzziness around the mouse focus model in the DOM (or as exposed by GWT?). For example, I discovered only by error that the mouse only ever hovers over one object at a time, the topmost object in case of stacking. This can make it difficult to implement behaviours that trigger whenever the mouse passes over an object, regardless of other objects that may lie in front of it. It would be interesting to see if there are any libraries out there that somehow capture these mouse focus and Z-index issues and expose them to the programmer in a somewhat higher level and/or more intuitive way. But library are no library, a more solid grasp of the underlying UI model would be a great help.
Aside from the various UI bugs and flakiness, one thing which became quite clear with the availability of the subsumption pattern is that having to move shapes around individually can be slow and frustrating (especially given with the Z-axis issues we have), and also a source of potential error, if for example we were to move a subsuming shape and forget to take its embedded subsumed shape along for the ride. A key feature here may be some sort of grouping mechanism, or perhaps a perhaps simple lasso-based selection idiom.
Diagram interpretation
Although we chose a patterns-based interface with the expressed purpose of constraining the interface (so that diagrams are more likely to be an accurate reflection of what the user intended), it became readily apparent there will be likely no getting around the need to develop what is effectively a free-form editor. The problem is that we already support some free-form editing operations that would be hard to do without — the ability to delete, resize, reposition, and relabel curves — and with each of these operations it can be quite easy to change the meaning of a diagram. Moving shapes around can cause them to intersect. Resizing a shape can cause it to include other shapes (so in fact it’s perfectly possible to express subsumption without the subsumption pattern). Right now, the plugin makes no attempt at interpreting or noticing these changes, which makes it extremely easy to cause the diagram to mean something very different and to have it go out of synch with the ontology.
One way of addressing the issue may be to work how to constrain the user interface even further so that the only things the user can express that are easy for the editor to notice and treat as an explicit intentional event. For instance, we may get a great deal of distance by simply refusing to let any resize/move operation cross a curve boundary (be it entering or leaving). But it seems like this sort of approach would mean us getting caught up in a perpetual game of whac-a-mole, anticipating the sort of semantic-changing operations a user could perform.
I believe we need a more general approach that guarantees that any possible diagram a user can draw will be (A) a well-formed concept diagram and (B) have a interpretation in the ontology. Roughly speaking, I believe we need a way for the plugin editor to read the canvas and convert what it sees to an abstract concept diagram along with the necessary translations needed to tie it in with the ontology backend. Furthermore, we will likely need a way to do this dynamically so that we are not just reading a canvas snapshot and dumping the results whole, but interpreting individual user actions and the corresponding changes to the abstract concept diagram and ontology.
Automated layout
That it was possible to extend WebProtégé to support something like this plugin is a testament to its modular design. Components interact with each other using a basic blackboard architecture, each component listening for and publishing events as needed. So having the plugin publish changes to the ontology, and having these changes be reflected in other standard WebProtégé components (the class tree viewer, the OWL entity description entity editor) is just a matter of events. By rights, we should also be to go full circle. At the moment, most changes to the ontology that come from other components are completely ignored by the diagram editor.
For the plugin to truly participate as a WebProtégé citizen, it must keep itself updated in light of any changes to the ontology that come its way. Among other things, this would entail some sort of automatic layout mechanism. In fact, the VMG already have done considerable work on the problem of automated layout (including an implementation such as iCircles), so this may just be a matter of integration. That said, one potentially important twist is that that we would presumably want diagrams to be as stable as possible, preserving as much of its original layout as new facts on the ground allow. Also because the diagram will change (however minimally) as a result of the automated layout, it may also be helpful to include some sort of animation for clarity, gradually shifting the parts of the diagram to accomodate new assertions.
No more duplicate curves
Finally, it’s worth taking a closer look at the decision to copy curves that participate in a subsumption event, and more broadly, to allow multiple curves for the same class. This is extremely unfortunate from a usability standpoint, because as shown in VMG experiments, the duplication severely impairs people’s ability to reason about diagrams. That said, in the context of building an interactive editor, it’s not clear what a better solution would be. I am confident there is one out there but it will require a lot more sophistication on the part of the plugin:
Moving one of the curves instead of copying it is a somewhat delicate affair because the relative location of a curve with respect to other curves (in a sort of topological sense) is semantically significant. We would need to account for other curves in the logical neighbourhood and recursively factor in any impact those curves have on those around. That said, we could also think about this problem in terms of automated layout. Perhaps in the long term, the right way to think about this problem is as one of automated diagram layout which we will already need anyway in the long term. In this case, using the subsumption pattern would simply corresponding to asserting a subsumption axiom and laying it out accordingly.
We would change the subsumption pattern to trigger on the first endpoint and draw an anonymous curve either inside or outside of the first snapped (depending on which endpoint was selected first). We could then force the user to enter a name for the newly drawn curve (not one that already exists), or monitor the diagram for when the user does insert a label (at which point we would update the ontology backend). This could be worth exploring but it comes at the potential cost of introducing yet another idiom to the user interface (that said, it’s too early to speculate on whether this is a bad thing or not)
Our current approach of simply copying the curves should be considered a stopgap measure, and a very unsatisfactory one at that. To go beyond that, we would likely need either automatic layout or diagram interpretation as prerequisites, neither of which should really be considered a dealbreaker because they are important to have in the general case anyway.
Abstract representation for diagrams
In developing the plugin, I had adopted a working style which deliberately emphasised visible results over correctness or maintainability. But this will not be sustainable if we want to move beyond the proof-of-concept stage. One particular sore point is that we have tried to get away without much of an abstract representation of the concept diagram editor. What little that passes for a model is a set of curves with an optional label/IRI along with some size/coordinate information, and in addition to this, an IRI to IRI parent relation mapping. Notice for example that although we have a notion of properties via the All Values From plugin, we don’t actually track them in any way.
It is going to be important to flesh out a much more robust and complete diagram model. In fact, some of the core functionalities we also need (automated layout, diagram interpretation) also rest on our having modeled concept diagrams correctly. A natural place to start looking would be theoretical work by the VMG in formalising concept diagrams. The formal model may serve as a strong starting point, but we may also need to extend it or a build a two-layer model that also reflects key physical properties, in other words, the sizes and positions of curves.
Better technologies
It is a design goal for the plugin to work with Protégé, or more to the point a popular and robust ontology editor. Our choice of WebProtégé in particular is motivated by our belief that this is where the future of the Protégé project lies. In a sense this somewhat ties us to the Java and GWT world, with even Scala (at the time of this writing) not being a helpful alternative. It seems that we are bound to Java to the extent that we wish to write client side code which translates to JavaScript, and to communicate with the WebProtégé server.
There are some avenues to explore still. Much of the user interface code relies on some fairly advanced JavaScript libraries which sometimes are made even more useful by GWT bindings Which expose the functionality with a friendlier Java API. It would be helpful to keep apprised of what’s new in the JavaScript user interface and graphics world. I’m attracted to the prospect of using D3 for example as an alternative to Raphaël and JsPlumb, mostly in the interest of reducing the number of distinct technologies out there, and also in the hope that introducing an element of animation can make the plugin easier to understand.
Being the inveterate Haskeller, I am still holding out hope for us exploring some way to write chunks of the plugin in Haskell (or anything better that comes along). What is at stake here is not so much direct productivity gains, but a kind of intellectual leverage provided the combination of concision and an advanced type system. Considering how much unexplored territory there is in designing this sort of editor, any tool that helps us to think more clearly would be great boon to the work. But then again what about the JavaScript frontend and the Java backend? Hope is not lost. There is a very intriguing subset of Haskell called Fay which from the looks of it generates very clean JavaScript. We already are using a fair amount of non-GWT JavaScript in the library, so why not take this to the logical conclusion writing essentially the whole plugin as a giant ball of Haskell-generated JavaScript? Integrating this into the WebProtégé client can be handled with a small Java/GWT wrapper. As for the backend, maybe communication with it could be shifted over to some web standard which we could talk directly with in Haskell/Fay. Alternatively, we could simply put the calls in the Java/GWT wrapper layer and expose them via JSNI. Another possible benefit of this approach is that we can perhaps do it incrementally and tentatively, slowly increasing the amount of responsibility we delegate to the JavaScript side of the codebase until we gain confidence in what we are doing.
Conclusion
As can often the case in an academic project, work on this plugin has only opened up a much longer section on important future work. We still have a lot of progress to make, even to get to a minimum viable editor people can play with.
Meanwhile, I have greatly enjoyed and gotten much out of this opportunity to work with the VMG. In particular, it was quite helpful for me to face a sort of triple-challenge, working in a completely different subject matter (I come from a natural language processing background, but that said, think that automatic visualiation plus language generation must be a interesting combo), different kind of programming (web-based user-facing application), with a lot of using a lot of mainstream tooling (Java, a fancy IDE) I was unfamiliar with. Programming is partly about versatility, an ability to plunge into the many forms of the unknown. Having emerged unscathed from the process gives me more confidence in my relationship with this craft. So, thanks VMG’ers!
Resources
For more information on concept diagrams and how you might use them for your ontology engineering needs, visit the Ontology Engineering homepage run by the VMG. Code for the plugin lives in a GitHub fork of webprotege.
Example concept diagrams have been generated with the most excellent Haskell diagrams library. See the source code to see how much easier it can be draw diagrams with Haskell than by hand.
You can too. I’m a semi-academic freelance programmer. I like to make tools to help people do interesting research, and am currently available half-time.↩
The boxes in this pattern represent separate contexts in which to make assertions about objects. The boxes do so much isolate the objects from each other — they are in the one and same universe — but our claims about them. So in example above, encasing
Class1andClass2in boxes simply means that we do not accidentally imply they are disjoint.↩An individual which does not have any values for a property trivially satisfies the all values from restriction↩